


Hello guys, In this article, we will explore d3.js - A progressive Data Visualization library.
WHAT IS D3.JS?
D3 is a compelling framework in web development. It is an open-source JavaScript library used to manipulate documents based on data. It produces dynamic visualizations of data for the web. D3.js provides the building blocks for displaying data through colorful charts, graphs, and maps – instead of boring text and spreadsheets.
D3 stands for Data-driven documents. D3.js helps you attach your data to DOM (Document Object Model) elements. Then you can use CSS, HTML, and/or SVG (scalable vector graphics) to showcase this data. You can also make the data interactive through the use of D3.js data-driven transformations and transitions.
D3 takes data that you provide, usually through an external file, and helps bring that data to life using HTML, CSS, and SVG (Scalable Vector Graphic). D3 is based on web standards which means it will run on all modern browsers without any strings attached. This allows you the ability to generate spectacular visual illustrations with your data.
Working with D3:
To access the d3-array function in an HTML document we can either load the d3.js library in full or just the specific module. If we were doing this from a traditional CDN service that might look something like the following when loading the full library
<script src="https://cdn.jsdelivr.net/npm/d3@7"></script>
To test the function to find the mean value of an array of numbers, we can use the d3.mean function as so
<script>

var a = [10, 53, 8, 99, 1, 6];
new_size = d3.mean(a);
console.log(new_size);

</script>
The output to the console will be the value 29.5 which is the mean value of the numbers 10, 53, 8, 99, 1, and 6.
To extend the example slightly the following adds two-paragraph lines to an HTML page, computes the mean value of an array, and then selects the first of our paragraphs and changes the size of the text to the mean value.
<body>

<!-- load the d3.js library -->
<script src="https://cdn.jsdelivr.net/npm/d3@7"></script>

<p>This is the first line</p>
<p>This is the second line</p>

<script>

var a = [10, 53, 8, 99, 1, 6];
new_size = d3.mean(a);
console.log(new_size);

d3.select("p").style("font-size", new_size + "px");

</script>

</body>
d3.select()
The d3.select() function in D3.js is used to select the first element that matches the specified selector string. If any element is not matched then it returns the empty selection. If multiple elements are matched with the selector then only the first matching element will be selected.
d3.select("element")
d3.selectAll()
The d3.selectAll() function in D3.js is used to select all the element that matches the specified selector string.
<!DOCTYPE html>
<html>

<head>
    <title>
        D3.js | d3.selectAll() Function
    </title>

    <script src = "https://d3js.org/d3.v4.min.js"></script>
</head>

<body>
    <p>GeeksforGeeks</p>

    <p>A computer science portal for geeks</p>

    <p>d3.selectAll() function</p>

    <script>

        // Calling the selectAll() function
        d3.selectAll("p").text();
    </script>
</body>

</html>
Enter Update Exit
Using D3’s enter and exit selections, you can create new nodes for incoming data and remove outgoing nodes that are no longer needed.
When data is bound to a selection, each element in the data array is paired with the corresponding node in the selection. If there are fewer nodes than data, the extra data elements form the enter selection, which you can instantiate by appending to the enter selection.
// Update…
var p = d3.select("body")
  .selectAll("p")
  .data([4, 8, 15, 16, 23, 42])
    .text(function(d) { return d; });

// Enter…
p.enter().append("p")
    .text(function(d) { return d; });

// Exit…
p.exit().remove();
There are lots of functions and features d3 provides us this is just a scratch. We can do interactive transformations and transitions using their
A bar chart example with D3.js:
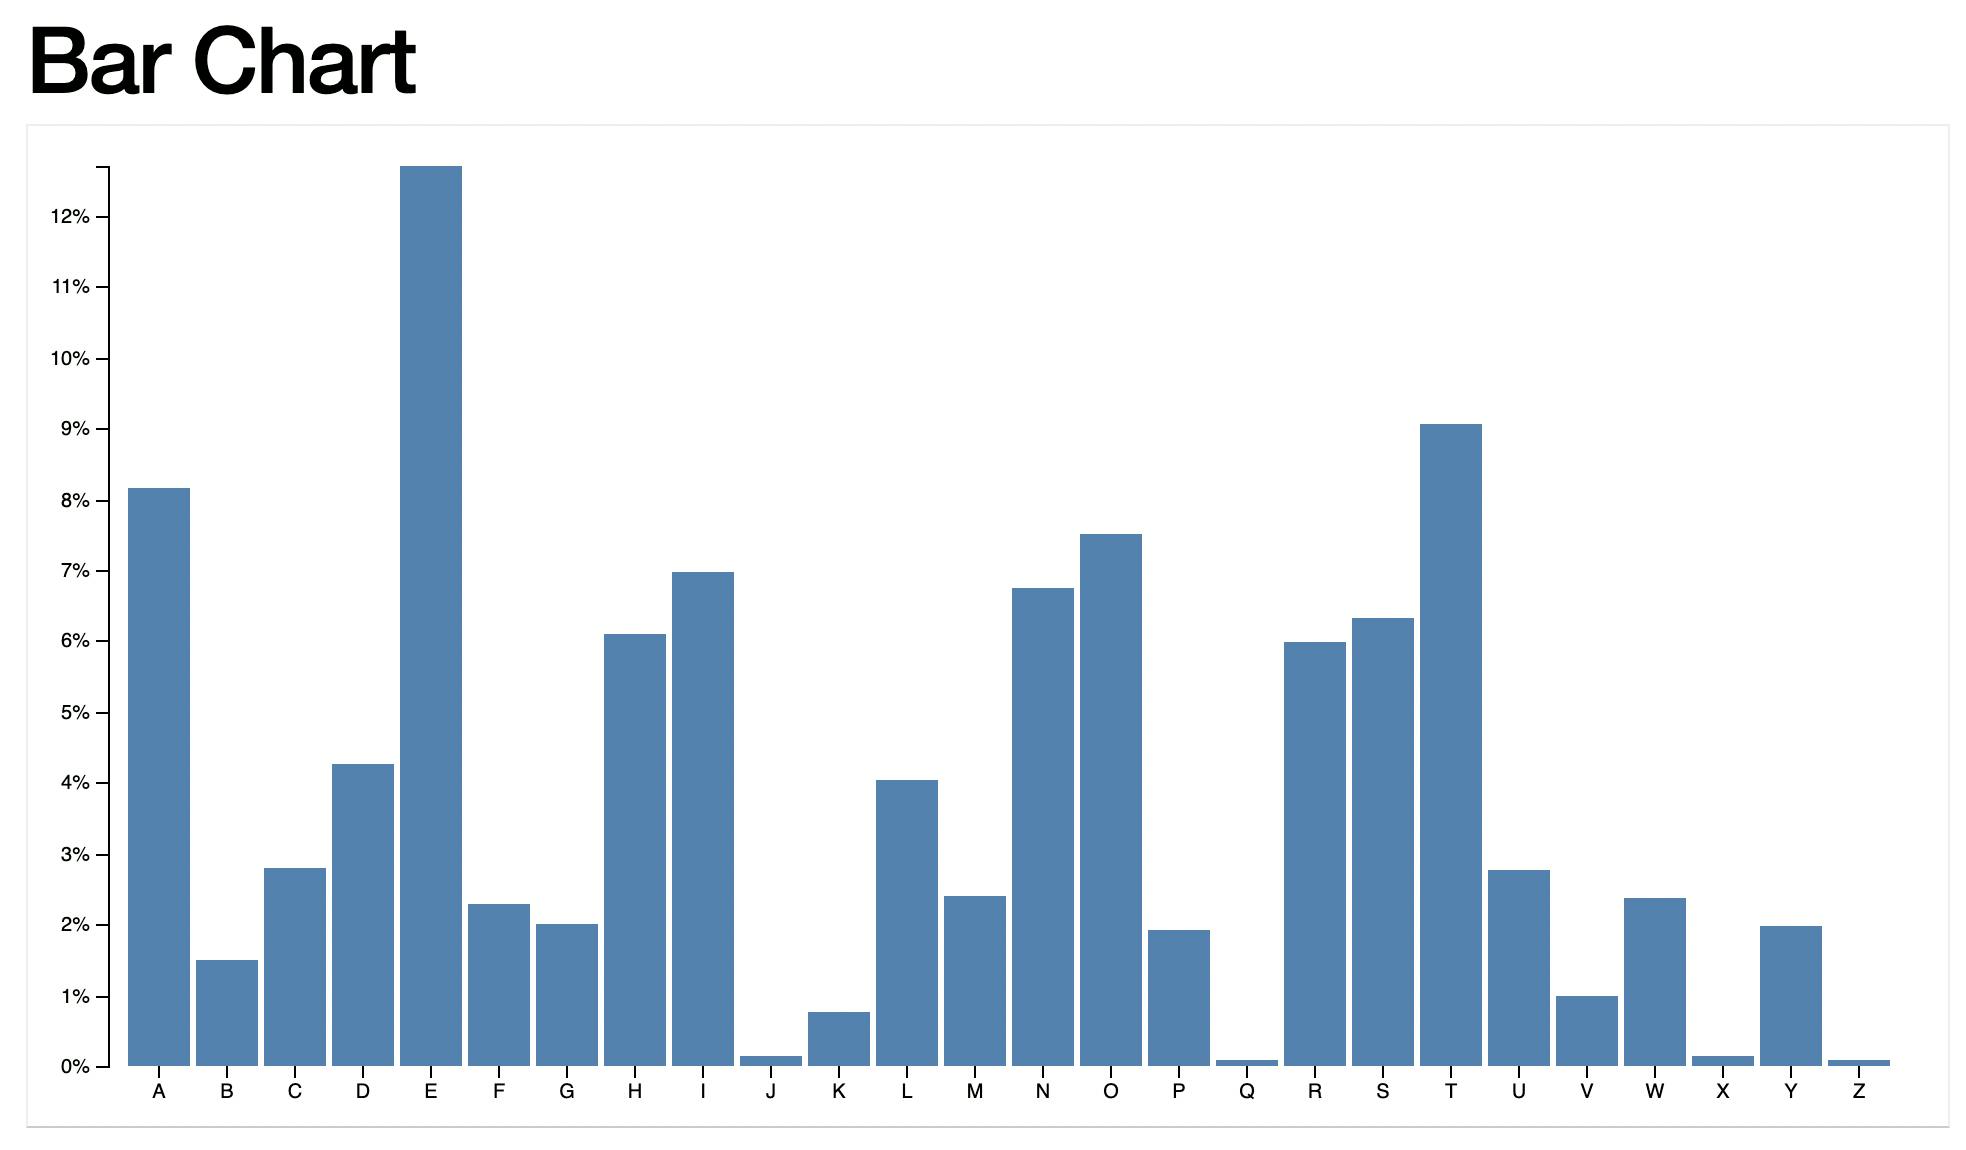
This simple bar chart is constructed from a TSV file storing the frequency of letters in the English language. The chart employs conventional margins and a number of D3 features:
- d3-dsv - parse tab-separated values
- d3-format - number formatting
- d3-scale - position encodings
- d3-array - data processing
- d3-axis - axes
<!DOCTYPE html>
<meta charset="utf-8">
<style>

.bar {
  fill: steelblue;
}

.bar:hover {
  fill: brown;
}

.axis--x path {
  display: none;
}

</style>
<svg width="960" height="500"></svg>
<script src="https://d3js.org/d3.v4.min.js"></script>
<script>

var svg = d3.select("svg"),
    margin = {top: 20, right: 20, bottom: 30, left: 40},
    width = +svg.attr("width") - margin.left - margin.right,
    height = +svg.attr("height") - margin.top - margin.bottom;

var x = d3.scaleBand().rangeRound([0, width]).padding(0.1),
    y = d3.scaleLinear().rangeRound([height, 0]);

var g = svg.append("g")
    .attr("transform", "translate(" + margin.left + "," + margin.top + ")");

d3.tsv("data.tsv", function(d) {
  d.frequency = +d.frequency;
  return d;
}, function(error, data) {
  if (error) throw error;

  x.domain(data.map(function(d) { return d.letter; }));
  y.domain([0, d3.max(data, function(d) { return d.frequency; })]);

  g.append("g")
      .attr("class", "axis axis--x")
      .attr("transform", "translate(0," + height + ")")
      .call(d3.axisBottom(x));

  g.append("g")
      .attr("class", "axis axis--y")
      .call(d3.axisLeft(y).ticks(10, "%"))
    .append("text")
      .attr("transform", "rotate(-90)")
      .attr("y", 6)
      .attr("dy", "0.71em")
      .attr("text-anchor", "end")
      .text("Frequency");

  g.selectAll(".bar")
    .data(data)
    .enter().append("rect")
      .attr("class", "bar")
      .attr("x", function(d) { return x(d.letter); })
      .attr("y", function(d) { return y(d.frequency); })
      .attr("width", x.bandwidth())
      .attr("height", function(d) { return height - y(d.frequency); });
});

</script>
letter    frequency
A    .08167
B    .01492
C    .02782
D    .04253
E    .12702
F    .02288
G    .02015
H    .06094
I    .06966
J    .00153
K    .00772
L    .04025
M    .02406
N    .06749
O    .07507
P    .01929
Q    .00095
R    .05987
S    .06327
T    .09056
U    .02758
V    .00978
W    .02360
X    .00150
Y    .01974
Z    .00074
We can do/create much more creative works on D3.js with basic shapes, svgs, and much more. By modifying only the attributes that actually change, D3 reduces overhead and allows greater graphical complexity at high frame rates. D3 also allows the sequencing of complex transitions via events. And, you can still use CSS3 transitions; D3 does not replace the browser’s toolbox but exposes it in a way that is easier to use.
outro:
I hope this article was useful and informative to you. D3 is a popular Dataviz library used by lots of developers and has a very big community.
Learn to learn new and explore new techs. I encourage you to explore D3.js and show up your creative side. It's really fun.
related resources:
HAPPY LEARNING
-JHA